Creating a quiz with a pie chart visualization in Google Forms requires combining the functionalities of both Google Forms (for the quiz) and Google Sheets (for the pie chart). Here’s how you can do it:
Table of content
- Part 1: Creating an online quiz on Google Forms
- Part 2: Isualizing Responses with a Pie Chart on Google Sheets
- Part 3: OnlineExamMaker: A free Google Forms quiz maker alternative for everyone
Creating an online quiz on Google Forms
1. Log into your Google account and go to Google Forms.
2. Create a new form: Click on the blank form or use a template.
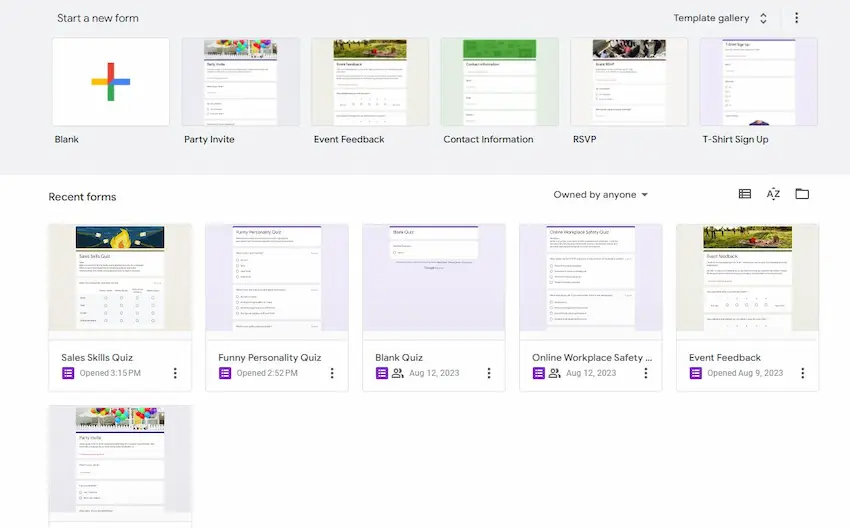
3. Set up your quiz:
• Title your form and add a description if needed.
• For each question, select the type of question you’d like to use (e.g., multiple choice, checkboxes, etc.).
• Continue to add all your questions.
4. Turn the form into a quiz:
• Click on the settings gear icon ⚙️ at the top right.
• Go to the “Quizzes” tab and select “Make this a quiz”.
• Choose when to release the scores (immediately after submission or later after manual review).
5. Set correct answers: For each question, click on the “Answer Key” option at the bottom to set the correct answers and assign point values.
Pro Tip
Want to assess your learners online? Create an online quiz for free!
Isualizing Responses with a Pie Chart on Google Sheets
Once you have responses to your quiz, you can visualize the data with a pie chart using Google Sheets.
1. Collect Responses: Share your quiz and get some responses.
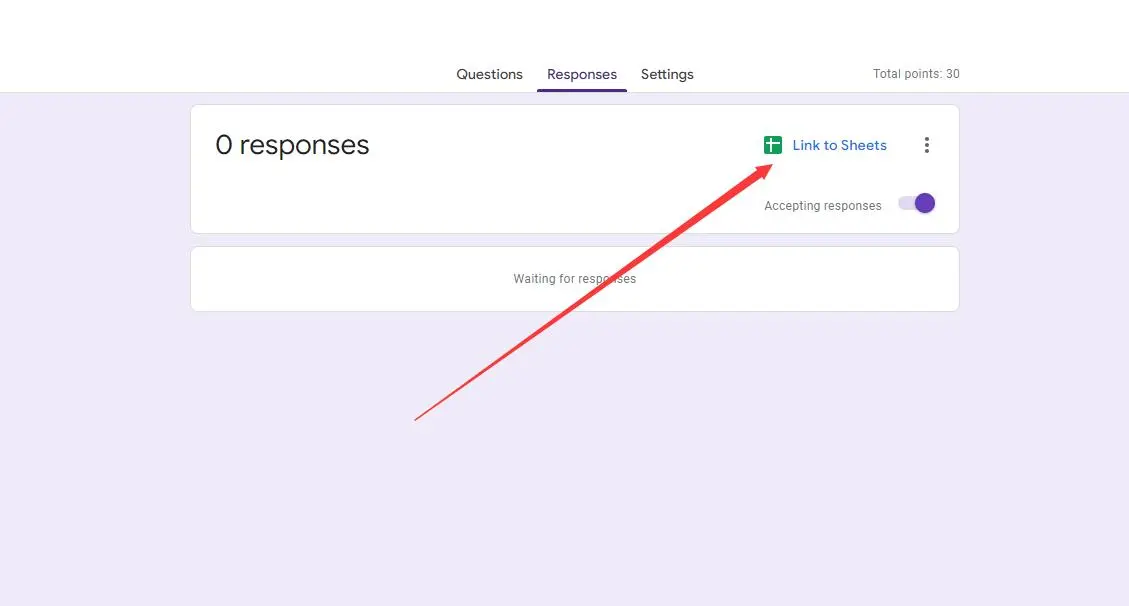
2. In Google Forms, go to the “Responses” tab.
3. Link Google Forms to Google Sheets: Click on the green Sheets icon to create a new spreadsheet or link to an existing one. This will transfer your responses to Google Sheets.
4. Create a Pie Chart in Google Sheets:
• Highlight the data you’d like to visualize (e.g., if you have a question “What’s your favorite color?” and 5 answers, highlight the colors and the number of responses for each).
• Click on ‘Insert’ in the top menu and choose ‘Chart’.
• From the Chart Editor on the right, select ‘Pie chart’.
• Customize the chart as needed using options from the Chart Editor.
Now, you’ll have a pie chart that visually represents the responses from your Google Forms quiz. You can then share, embed, or use the pie chart as desired. Remember, Google Forms won’t directly create pie charts for you. It’s the combination of Google Forms and Google Sheets that allows for this visualization.
OnlineExamMaker: A free Google Forms quiz maker alternative for everyone
With OnlineExamMaker, you can create online quizzes, performance assessments, practice tests to assess leaners’ knowledge and skills, and boost their engagement & improve knowledge retention. Supporting up to 10 question types, teachers are able to create quizzes with multiple-choice, true or false, matching, and open-ended questions, OnlineExamMaker provides flexibility in creating professional assessments.
Key Features
Question Report: Generate automated report for each question, with details to the count of correct, incorrect and skipped answers. Graphs in the form of pie charts illustrating the percentage response of up to 2 values of decimal for all questions are developed instantaneously.
Public Homepage: Create a custom public homepage on onlineexammaker.com, add exams, advertising banners, courses, and company profile to homepage easily.
Create Your Next Quiz/Exam with OnlineExamMaker
How to make a professional online quiz with OnlineExamMaker?
Step 1: Sign In or Sign Up
Step 2: Set up a new quiz
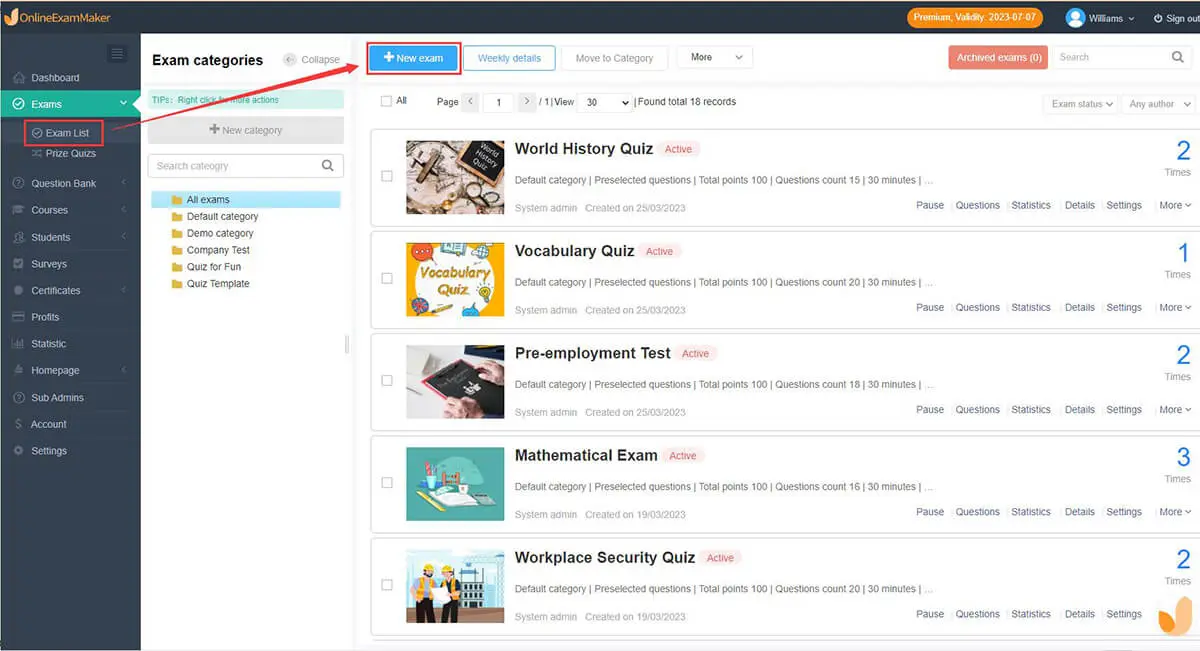
You might need to enter details like the name of the test, description, time limit, and other settings. Fill in the necessary information.
Step 3: Quiz settings

Configure any additional settings such as whether you want to randomize the question order, set a time limit, or establish passing criteria.
Step 4: Publish or Assign
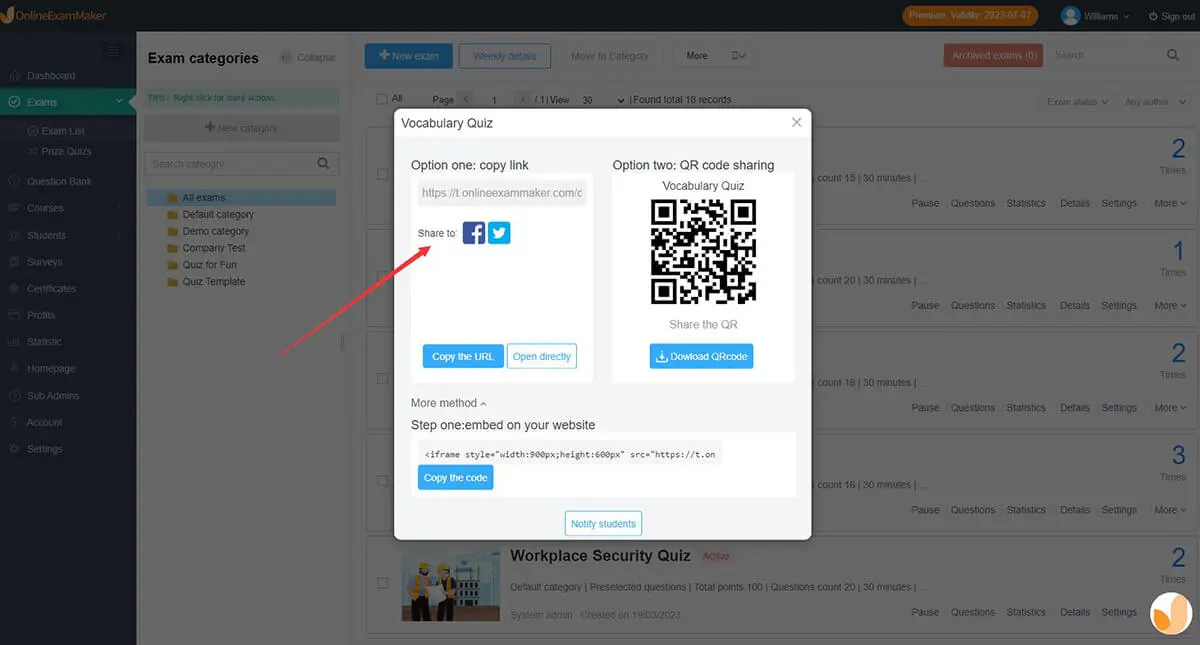
Once the test is finalized, you will have options to publish it. You may be given a unique link or code to share with test-takers, or you may be able to assign the test directly.